︎
email me ︎
JOE
SWAINSO
N
DESIGN
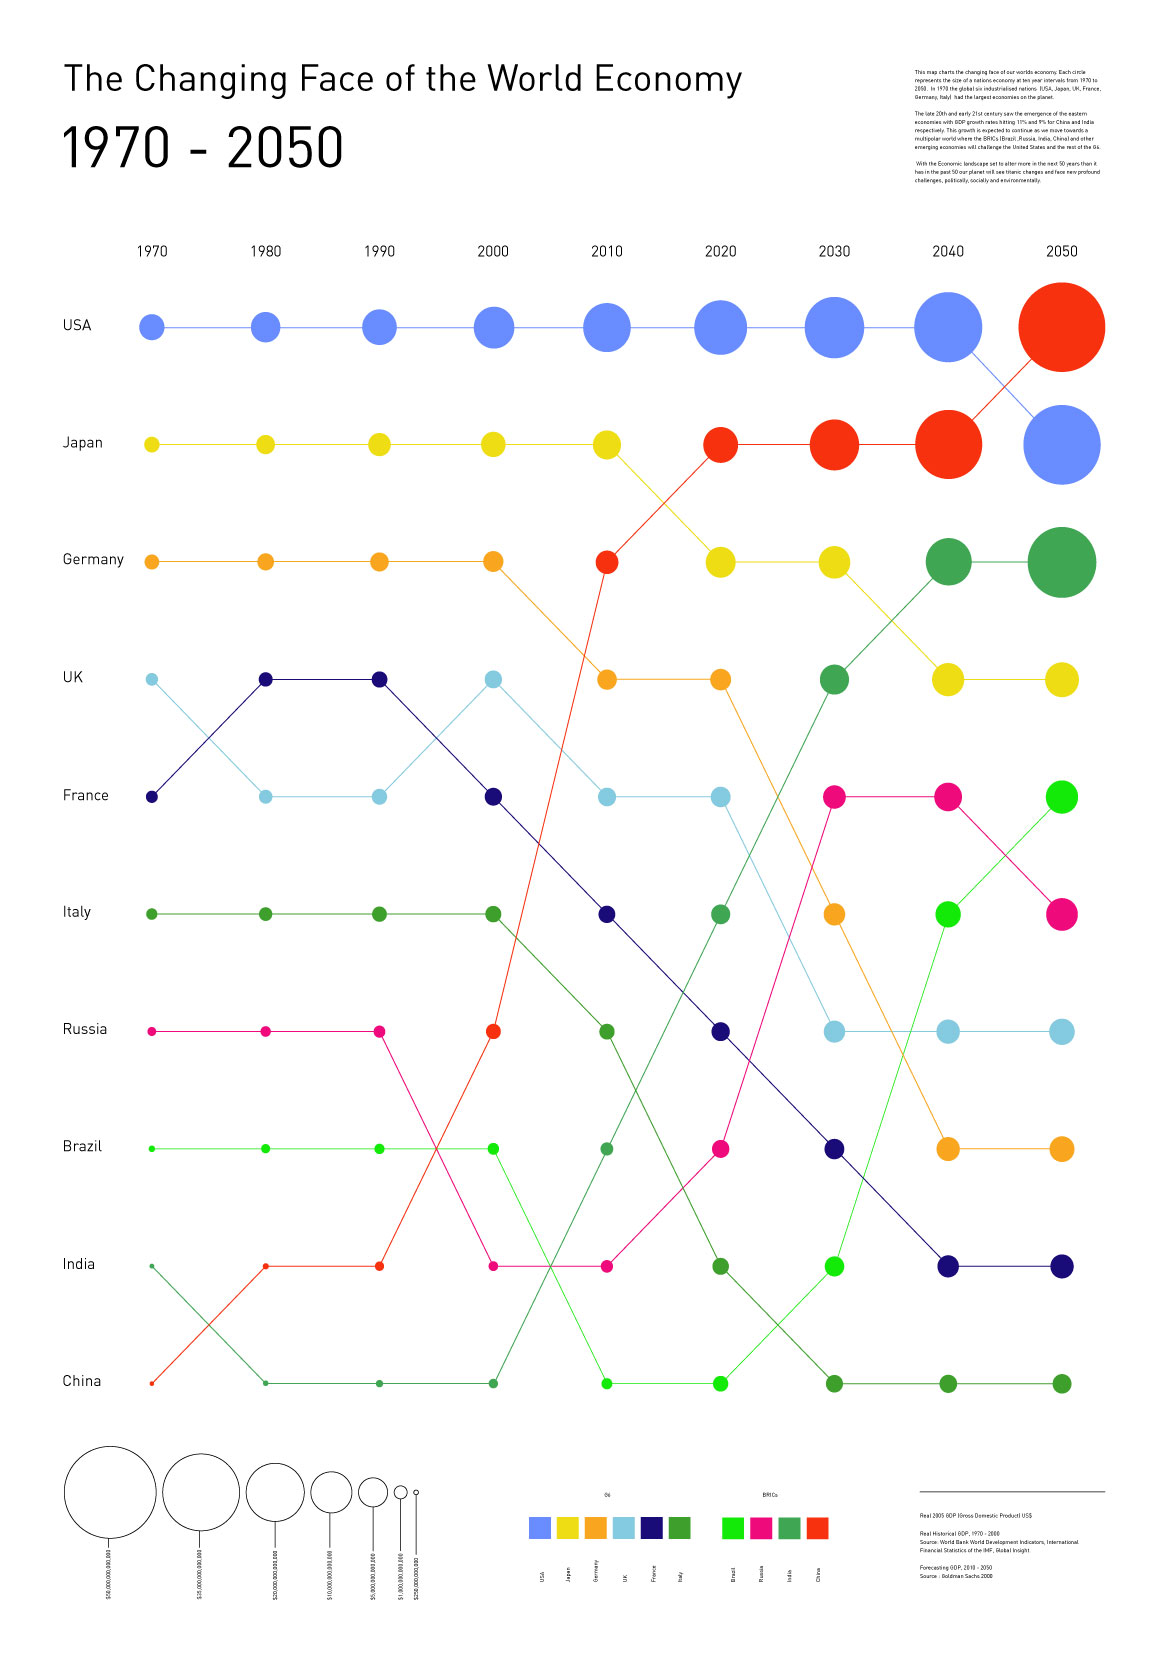
Featured in Fast Company, this data visualization shows the shift in the global economy. Comparing the hierarchy of BRIC & G6 nations, each circle represents the size of a nations economy in real GDP at ten year intervals from 1970 to 2050.
Joe Swainson Design Ltd © 2023